Runs & observability
Observability & analytics
Outcome metrics that tell you whether the agents are doing well.
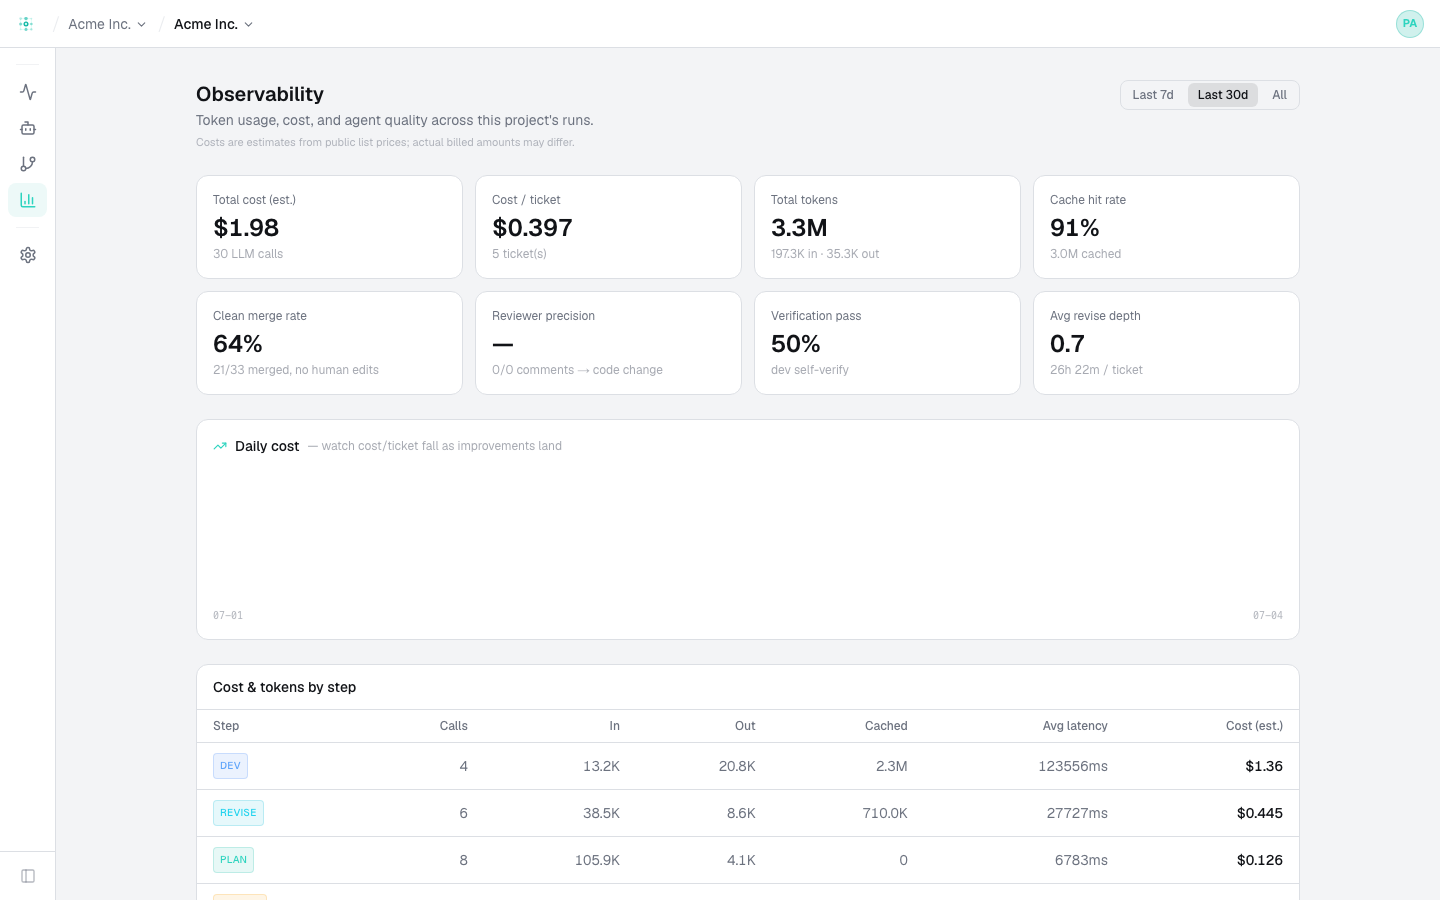
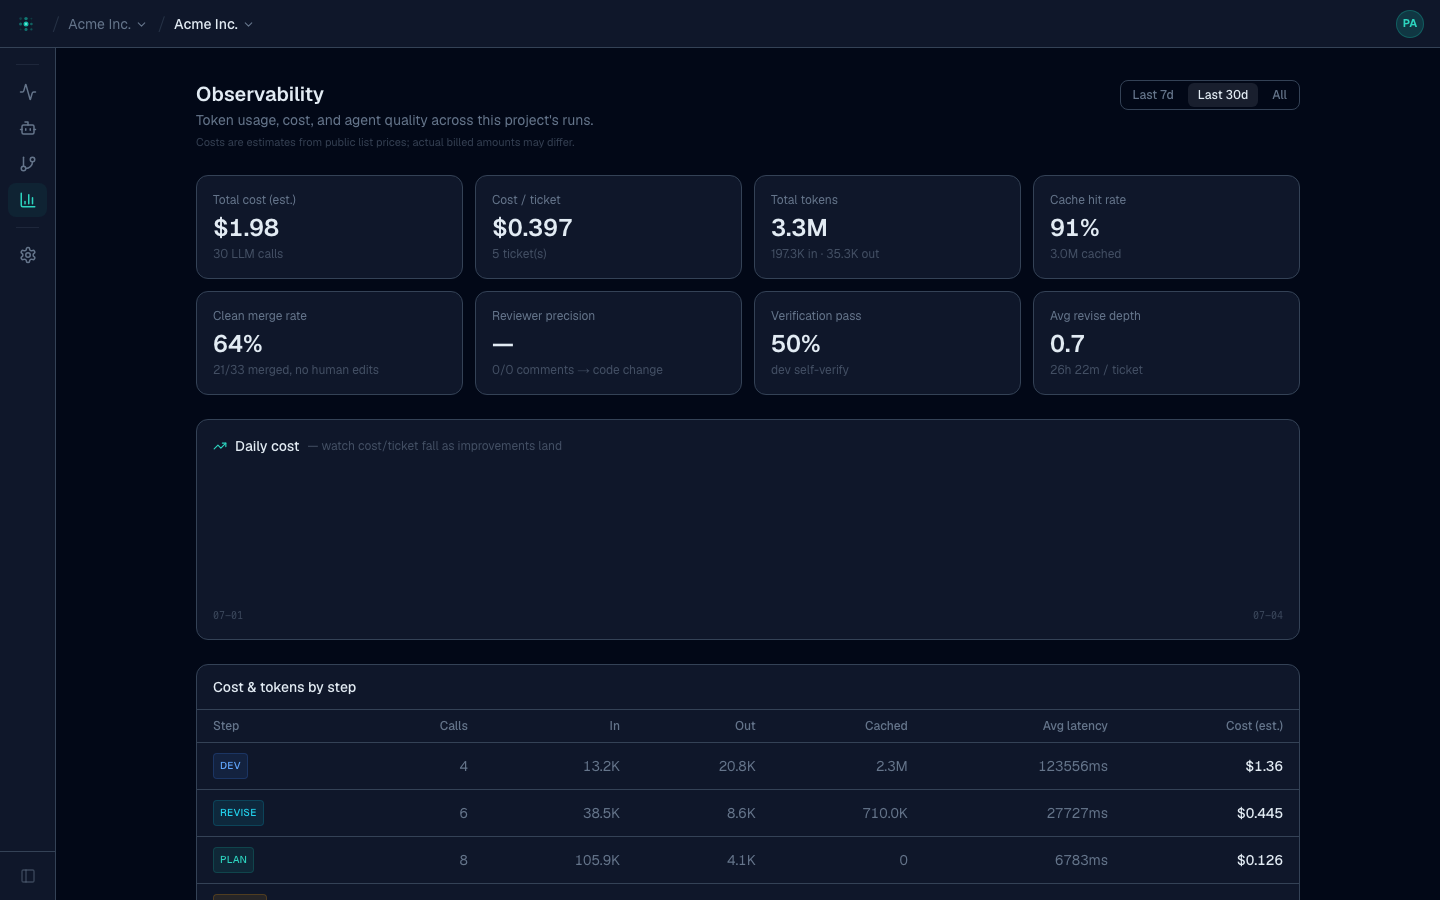
The Observability page aggregates run data across your org so you can see quality and spend trends — not just individual runs.
Outcome metrics
- PR acceptance — how often Premia's PRs are merged without human code changes.
- Reviewer precision — how often the Reviewer's comments result in actual code changes (high = the reviewer is accurate; low = noisy).
- Cost & latency — spend and time broken down by pipeline step, so you can see where tokens go.
Why it matters
These are the numbers that tell you whether a prompt or model change actually helped. Watch acceptance and precision over time as you tune your pipeline and agents.
For the money view (this cycle's tickets, overage, hosted-LLM cost, projected invoice), see Settings → Usage and Billing.