Runs & observability
The run detail view
Everything about a single run — steps, plan, and logs.
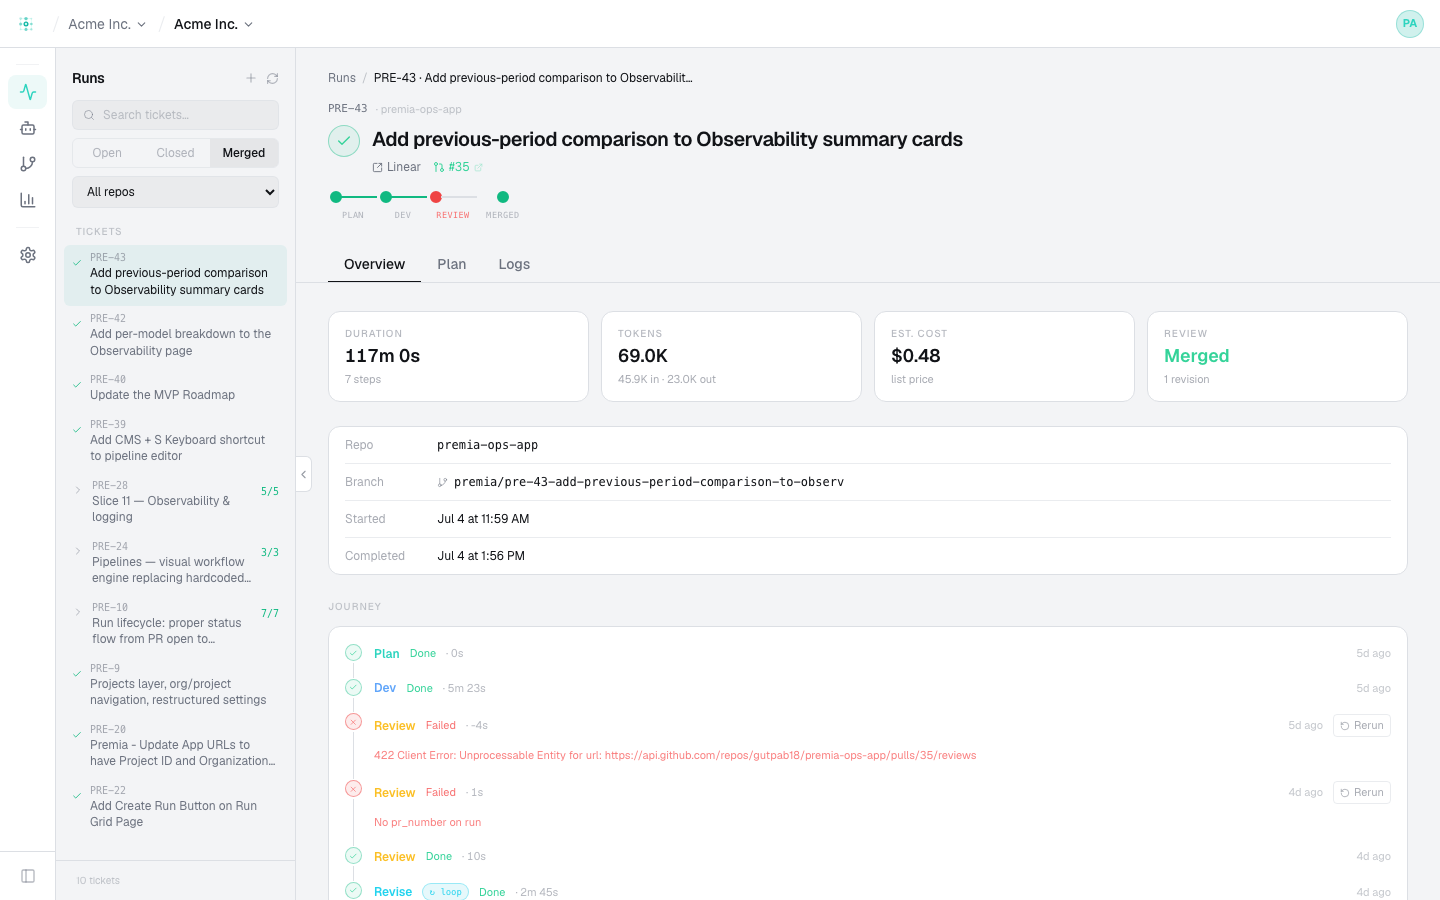
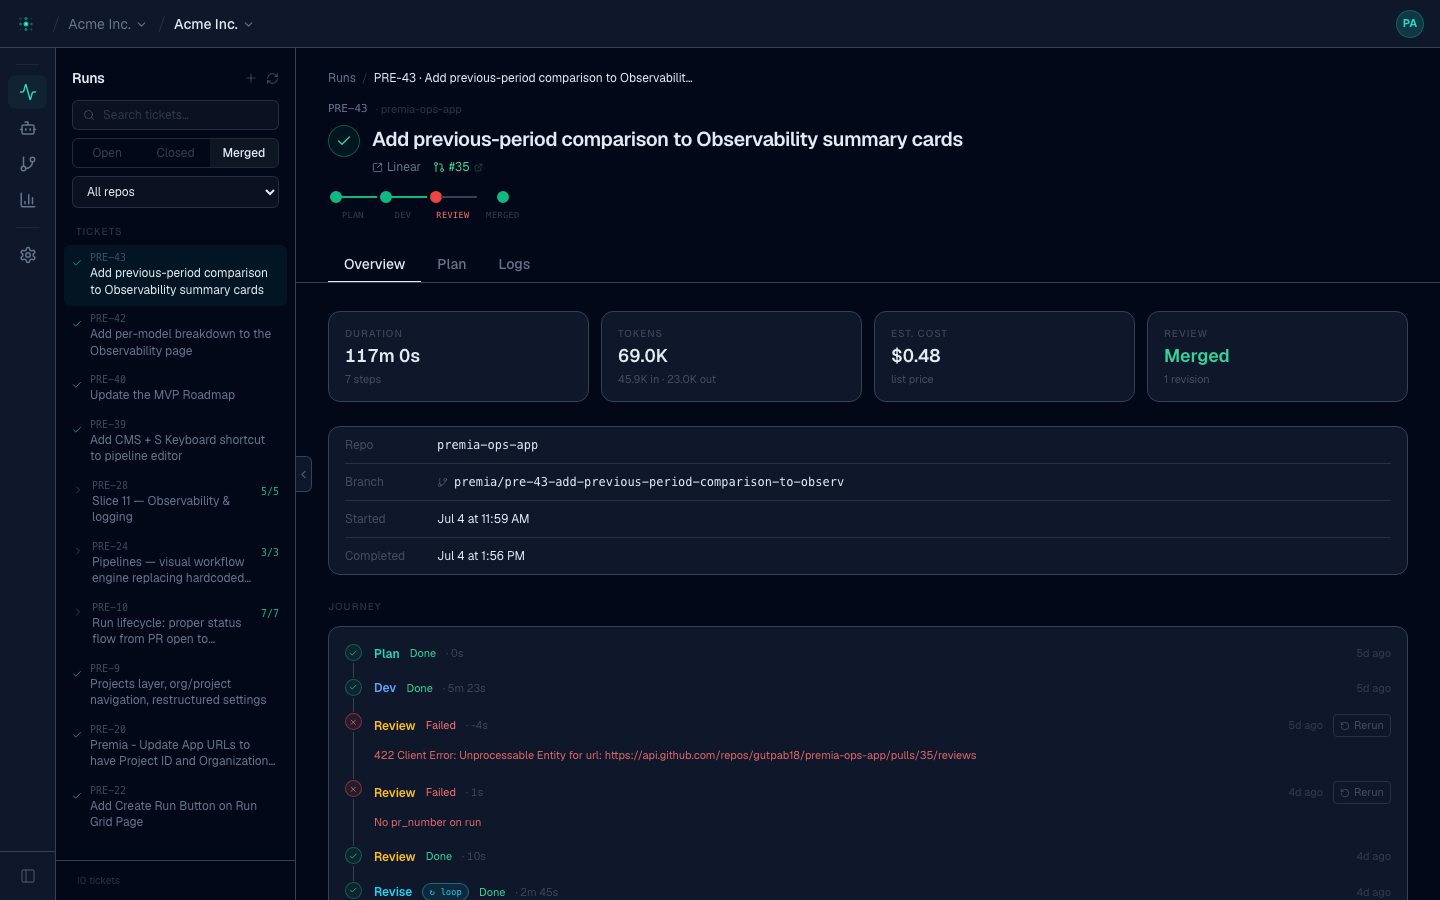
Opening a run shows its journey and three tabs.
The journey
A pipeline tracker across the top shows each step's status as the run advances (Planner → Developer → Reviewer → QA → Requirements → Merger), plus links to the Linear issue and the PR.
Tabs
- Overview — status, timing, and per-task breakdown. For a ticket that fanned out to several repos, each sub-task (with its own PR and status) is listed here.
- Plan — the implementation plan the Planner produced, per repo, rendered as a document. Use Expand for a full-screen, distraction-free read.
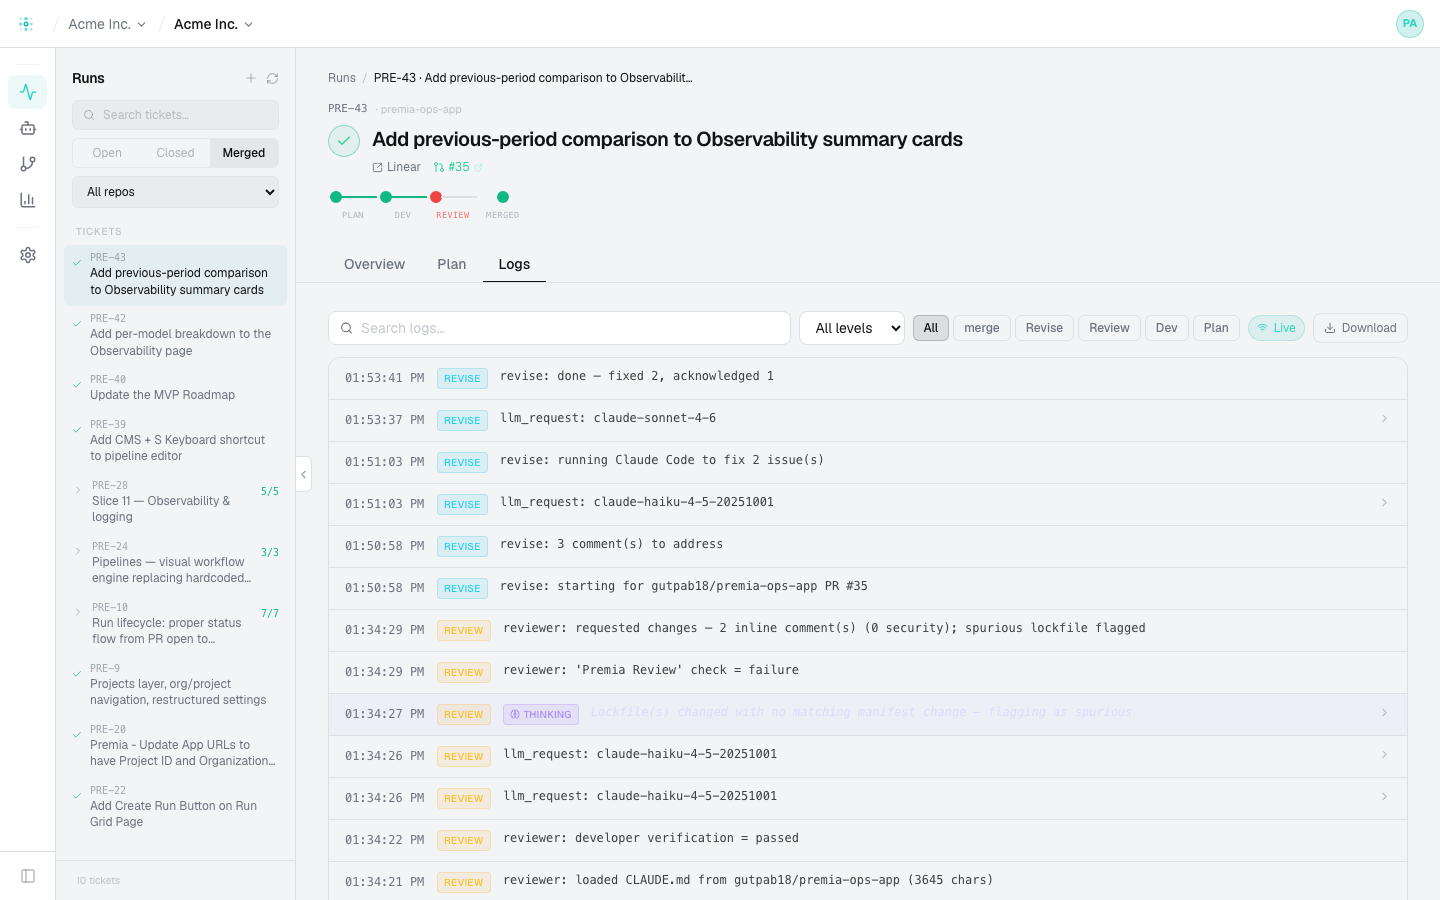
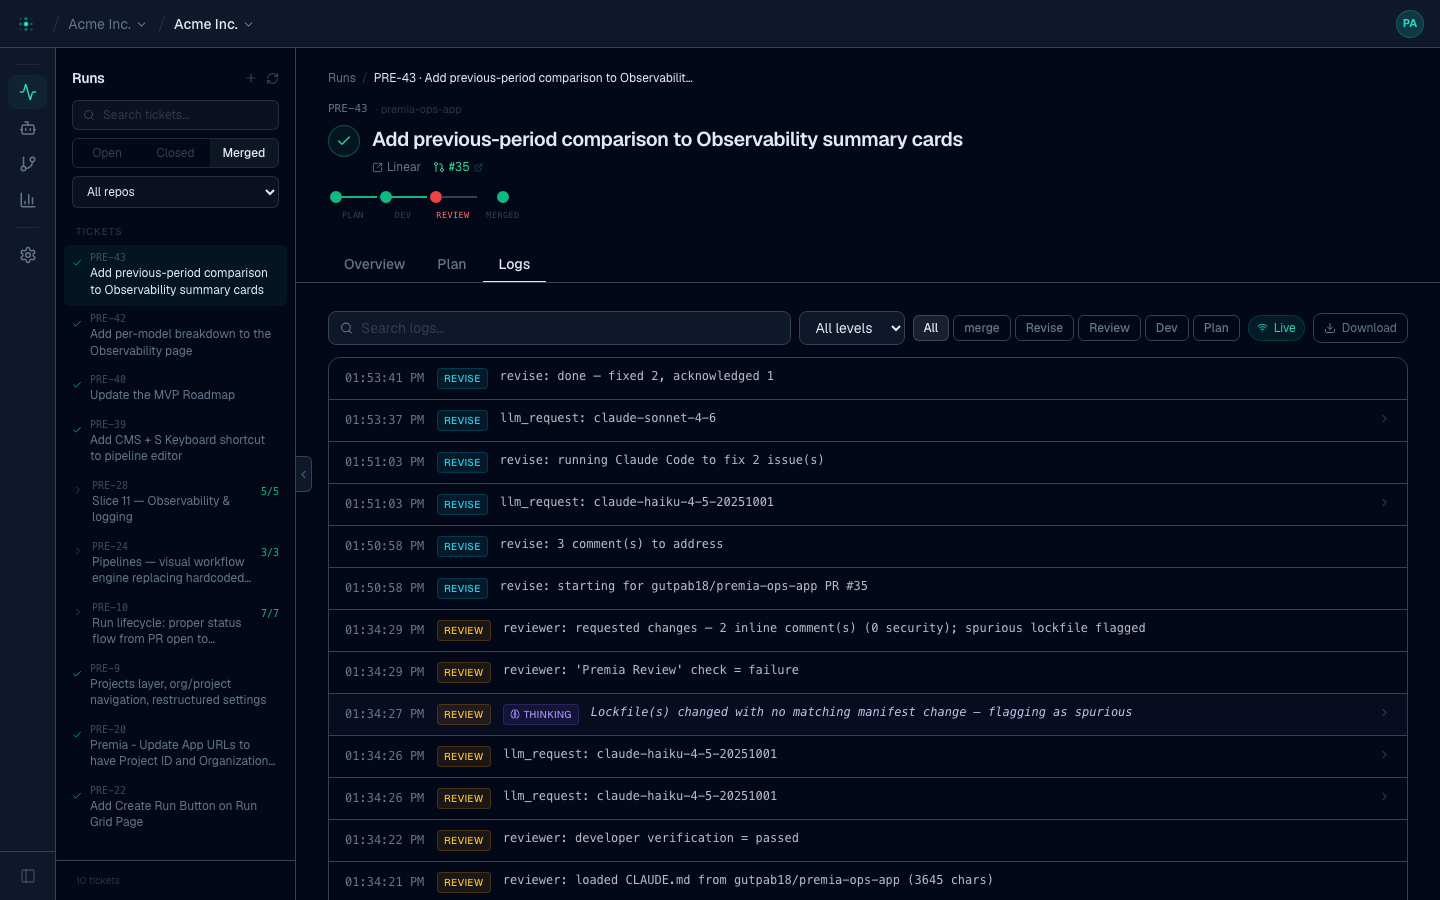
- Logs — structured, streaming logs for the run and its child steps, filterable by level, with token counts and cost.
Cost & tokens
Logs record input/output/cached tokens and latency per LLM call. This rolls up into the per-run cost you see here and the org-wide analytics.
From the CLI
premia runs view <id>            # steps + child tasks
premia runs logs <id> --follow   # tail live logs until the run finishes
premia runs cancel <id>